The approach
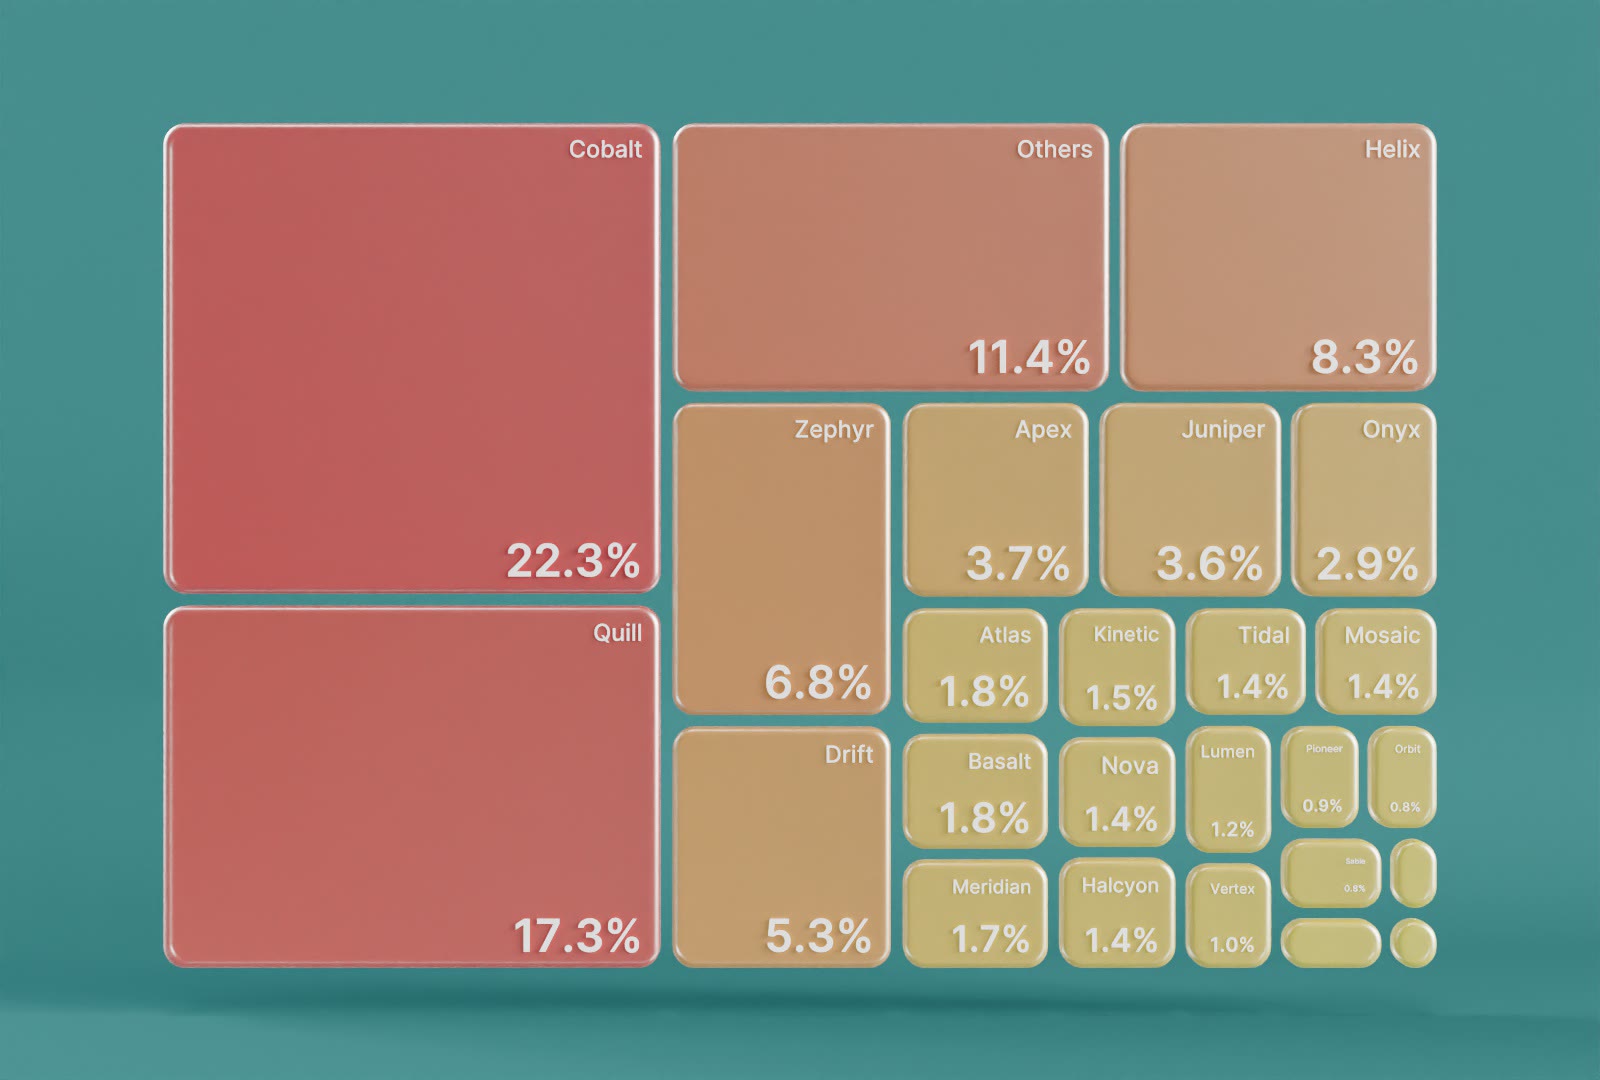
One system for all. The same setup produces different charts by swapping the numbers, labels and palette.
Colour. Playful pastel colours with a gradient.
Motion. Quick, bouncy transitions reveal the data points, and every tile is sized to the value it holds.
Easy to version. Easy to adapt to formats like 16:9 and 9:16, so one dataset can become a presentation slide and a social post.